
Response to TCFD
The Sinanen Holdings Group has expressed its support for the TCFD (Task Force on Climate-related Financial
Disclosures) recommendations to further improve the effect of measures against climate change, which is a
key management issue, and participates in the TCFD Consortium, which is a forum for supporting companies and
financial institutions to hold discussions.
In addition, by recognizing the various risks caused by the impact of climate change, ascertaining the
market changes as well as opportunities and threats from various perspectives, and engaging in efforts to
improve efficiency and optimization, we will be able to fulfill our social mission of delivering energy to
customers safely and stably, while at the same time contributing towards the reduction of greenhouse gas
emissions and mitigating the impact on climate change.
The Group regards the response to climate change as an important management issue, and has established
a Sustainability Promotion Committee chaired by the President and CEO of Sinanen Holdings Co., Ltd.;
issues concerning sustainability in general are ascertained across the Group, and discussions are held
regarding specific response measures and the setting of targets.
The deputy chairperson of the Sustainability Promotion Committee is the Chief Compliance Officer, who is
the chairperson of the Risk Management and Compliance Committee, to enhance the comprehensiveness of
risk management for the entire Group, and the members of the committee comprise of the persons in charge
at the relevant departments with jurisdiction over Group-wide initiatives, which allows for the
strengthened interconnectedness of business.
Details on the discussions and decisions by the committee will be reported to the Board of Directors,
which will approve the measures to be implemented by the Group and provide necessary advice.
In addition, the progress of the sustainability initiatives of the Group, including the response to
climate change, will be reported to the Board of Directors at least once per year.

The climate change risks and opportunities scenario analysis targets the petroleum business and LP gas
business, which occupy over 80% of Group sales (FY 2021 results), due to the size of their expected
financial impact.
We set 2050 as the analysis time axis, as this is when migration risks and physical risks will become
larger and apparent, and have conducted analysis for the scenarios at both 4°C and 2°C.
For the analysis method, we identified the items that are closely related to the business of the Company
from the SDGs targets and TCFD recommended disclosure items, and performed calculations for migration
risks and physical risks respectively.
The analysis work was focused on migration risks, which will have a high level of impact on business,
and for physical risks, we mainly calculated the level of impact of natural disasters on the real estate
owned by the Company.
Risks and opportunities were organized for each item, their timing of occurrence was categorized as
short term, medium term, or long term, and their level of impact was categorized as low, medium, and
high.
| TCFD Category | Item | Risk | Opportunity | Timing of Occurrence | Level of Impact | |
|---|---|---|---|---|---|---|
| Migration Risks |
Policy and regulation | Introduction of carbon taxes and carbon pricing |
|
|
Medium to long term | High |
| Setting of decarbonization target |
|
|
Medium to long term | High | ||
| Market | Changes in energy mix / changes in energy prices |
|
|
Short to medium term |
High |
|
Increased market share of carbon-free products |
|
|
Short to medium term |
Medium |
||
| Technology | Introduction of new decarbonization and low carbon technology |
|
|
Short to medium term |
Medium to high |
|
| Risk in investing in the development of new technology |
|
|
Medium to long term | Medium |
||
| Reputation | Changes in demand due to consumer preference for carbon-free |
|
|
Medium to long term |
Low |
|
Increased amount of concern from stakeholders |
|
|
Medium to long term |
Low to medium |
||
| Physical Risks |
Acute risks | Occurrence of flood damage due to typhoons and heavy rains |
|
|
Short to medium term |
Medium |
| Chronic risks | Rise in sea levels |
|
|
Medium to long term |
Low | |
| Rising average temperature |
|
|
Medium to long term |
Low | ||
In regard to following materialities selected in the assessment of risks and opportunities that have a
high level of impact, we selected relevant scenarios and parameters, and evaluated the financial impact
for each scenario at 4°C and 2°C respectively.
In regard to the materiality items specified by the scenario analysis, we will improve strategic
resilience through the reflection of these in the formulation of our long term vision and medium-term
management plan, in order to minimize the risks and to maximize the opportunities.
Materialities with High Impact
| Changes in sales due to climate change | Changes in costs due to climate change |
|---|---|
Decreased sales due to decreased demand
|
Increased costs in conjunction with the introduction of carbon taxes and carbon
pricing
|
| Increased sales in the renewable energy business | Increased transportation expenses
|
| Increased sales of fossil fuel alternatives | Increased capital investment
|
The Group collects and analyzes information on a wide range of risk factors, such as climate
change-related regulations and the impact on business.
The important opportunities and risks that should be kept in mind are assessed and specified at the
Sustainability Promotion Committee, and are supervised and monitored by the Growth Strategy Department,
which is the committee's secretary office.
In addition, the Chief Compliance Officer concurrently serves as the deputy chairperson of the
Sustainability Promotion Committee and the chairperson of the Risk Management and Compliance Committee,
which allows for the sharing of issues between the two committees and the integrated performance of risk
management across the organization.
The Group has set the two indicators of GHG emissions and carbon productivity for the assessment and management of climate change risks and opportunities, and will simultaneously realize business growth and reduced GHG emissions.
| Indicator | Target | Target Scope |
|---|---|---|
| (1) GHG emissions | Reduction of GHG emissions | Scope1+2 |
| (2) Carbon productivity | Business growth and increased carbon efficiency | Scope1~3 |
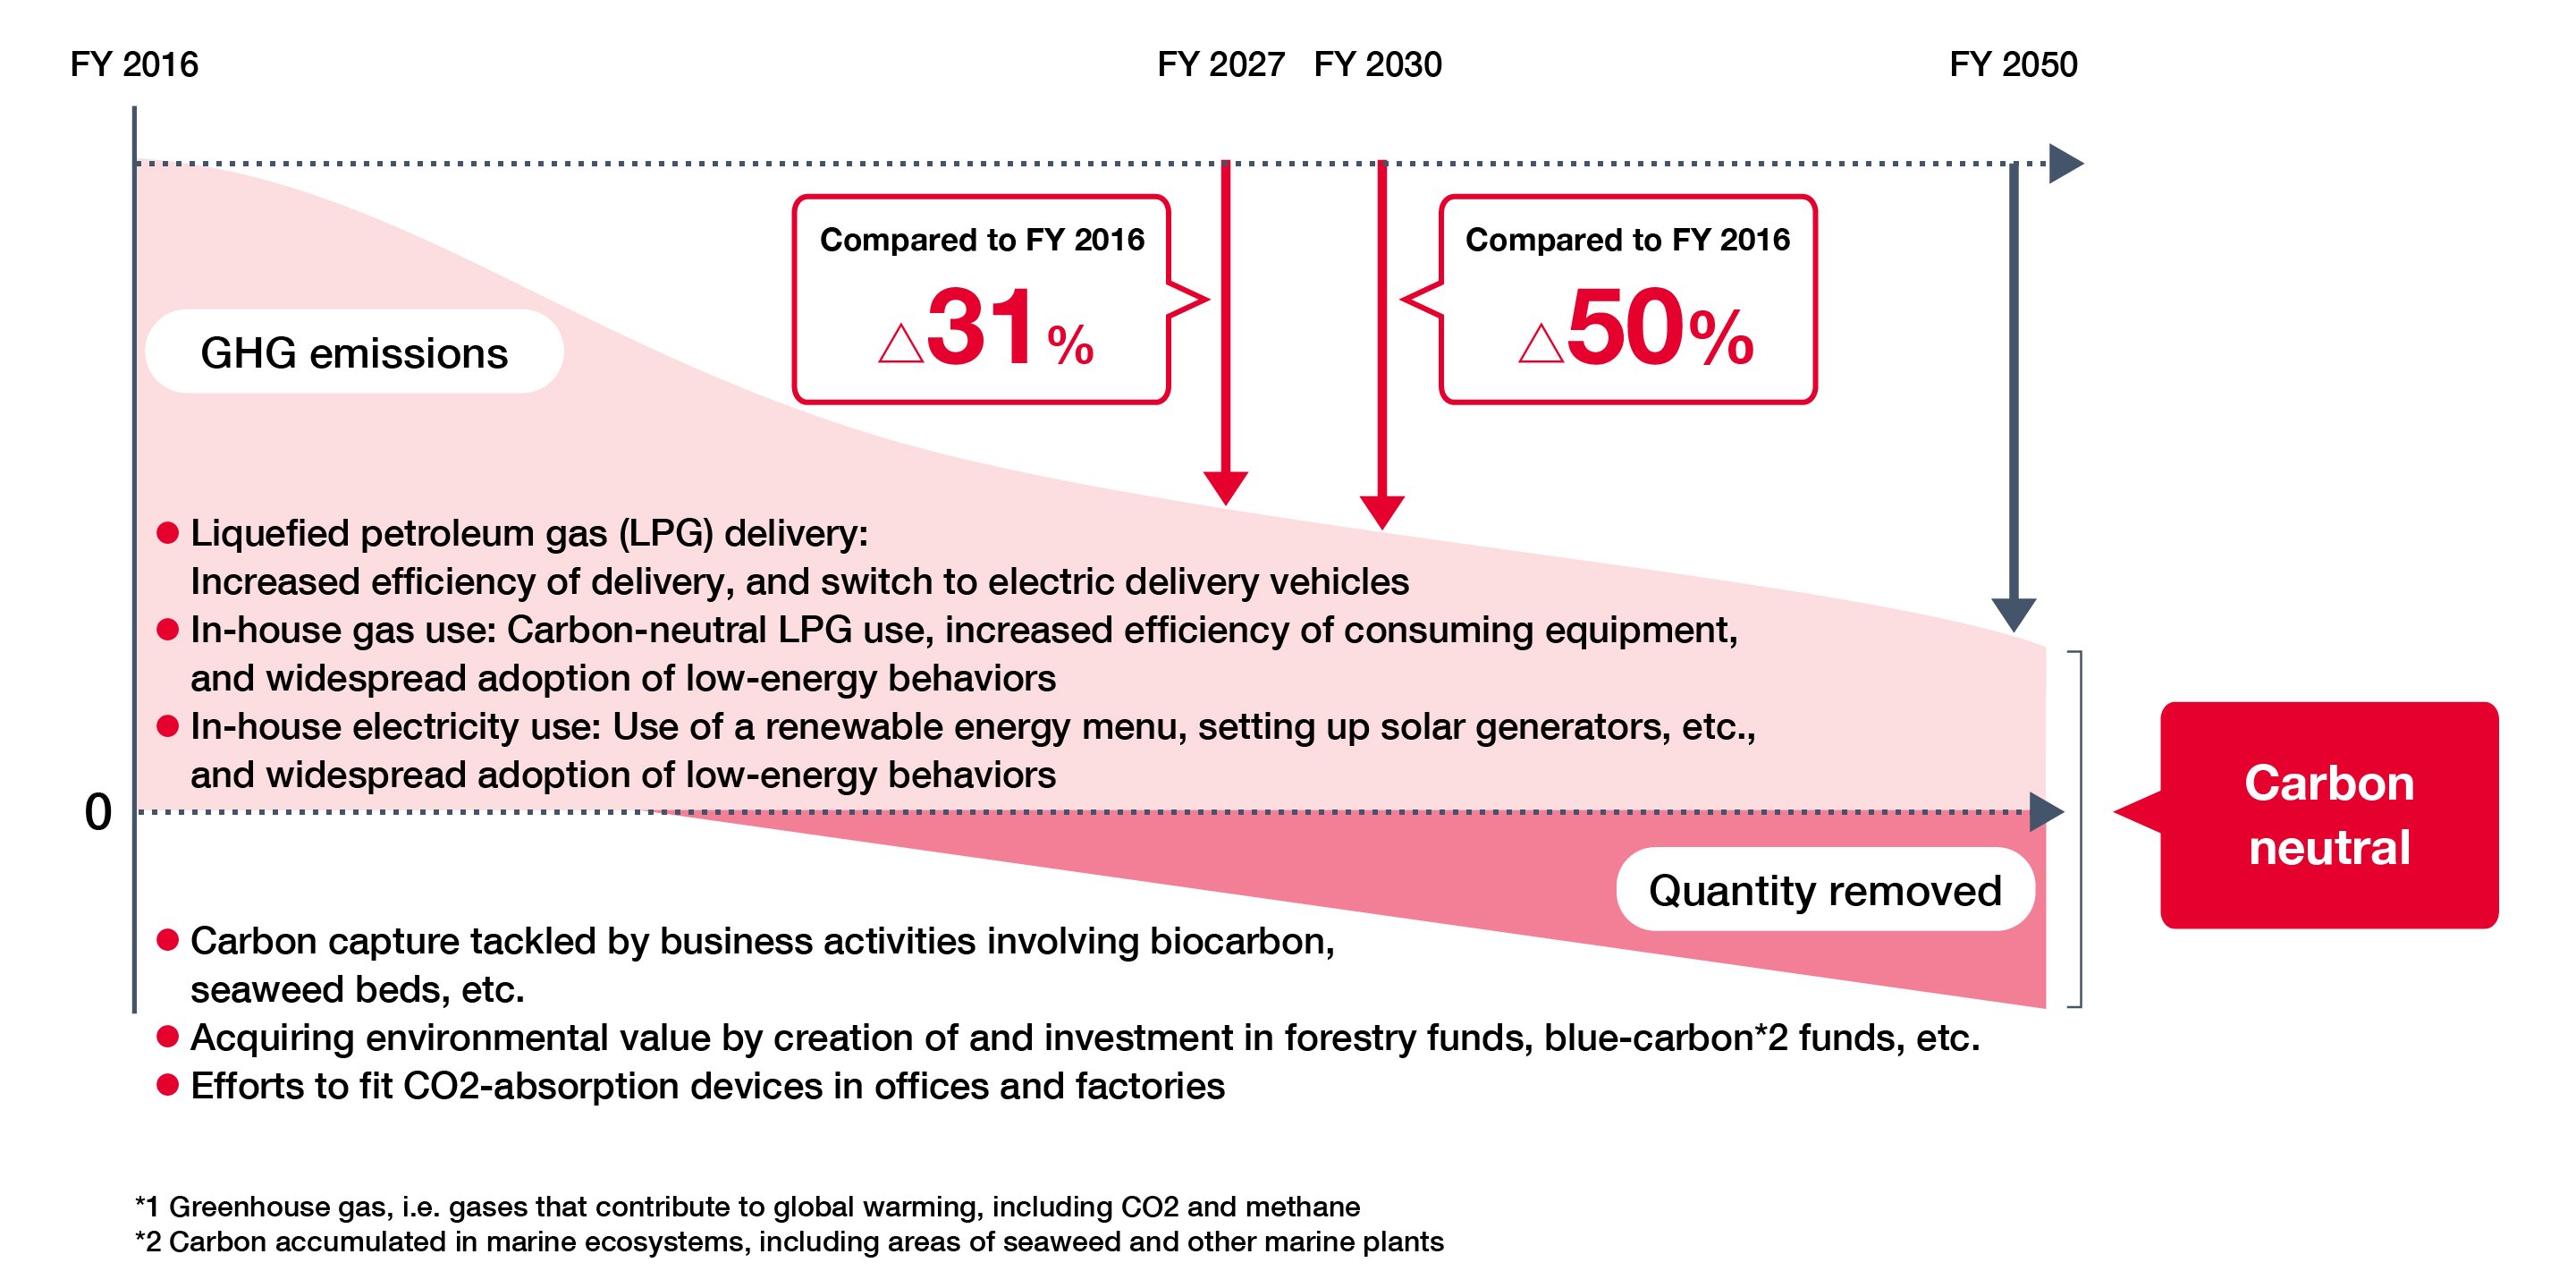
Upon having calculated the overall emissions of Scope 1 to 3, we set targets for reduction with a focus on Scope 1 and Scope 2, for which there is significant margin for reductions through our own efforts.
| Subject Fiscal Year | Reduction Target |
|---|---|
| FY 2030 | Scope 1 + Scope 2 50% reduction (compared to FY 2016) |
| FY 2050 | Scope 1 + Scope 2 carbon neutral (substantially zero emissions) |
Specific Initiatives
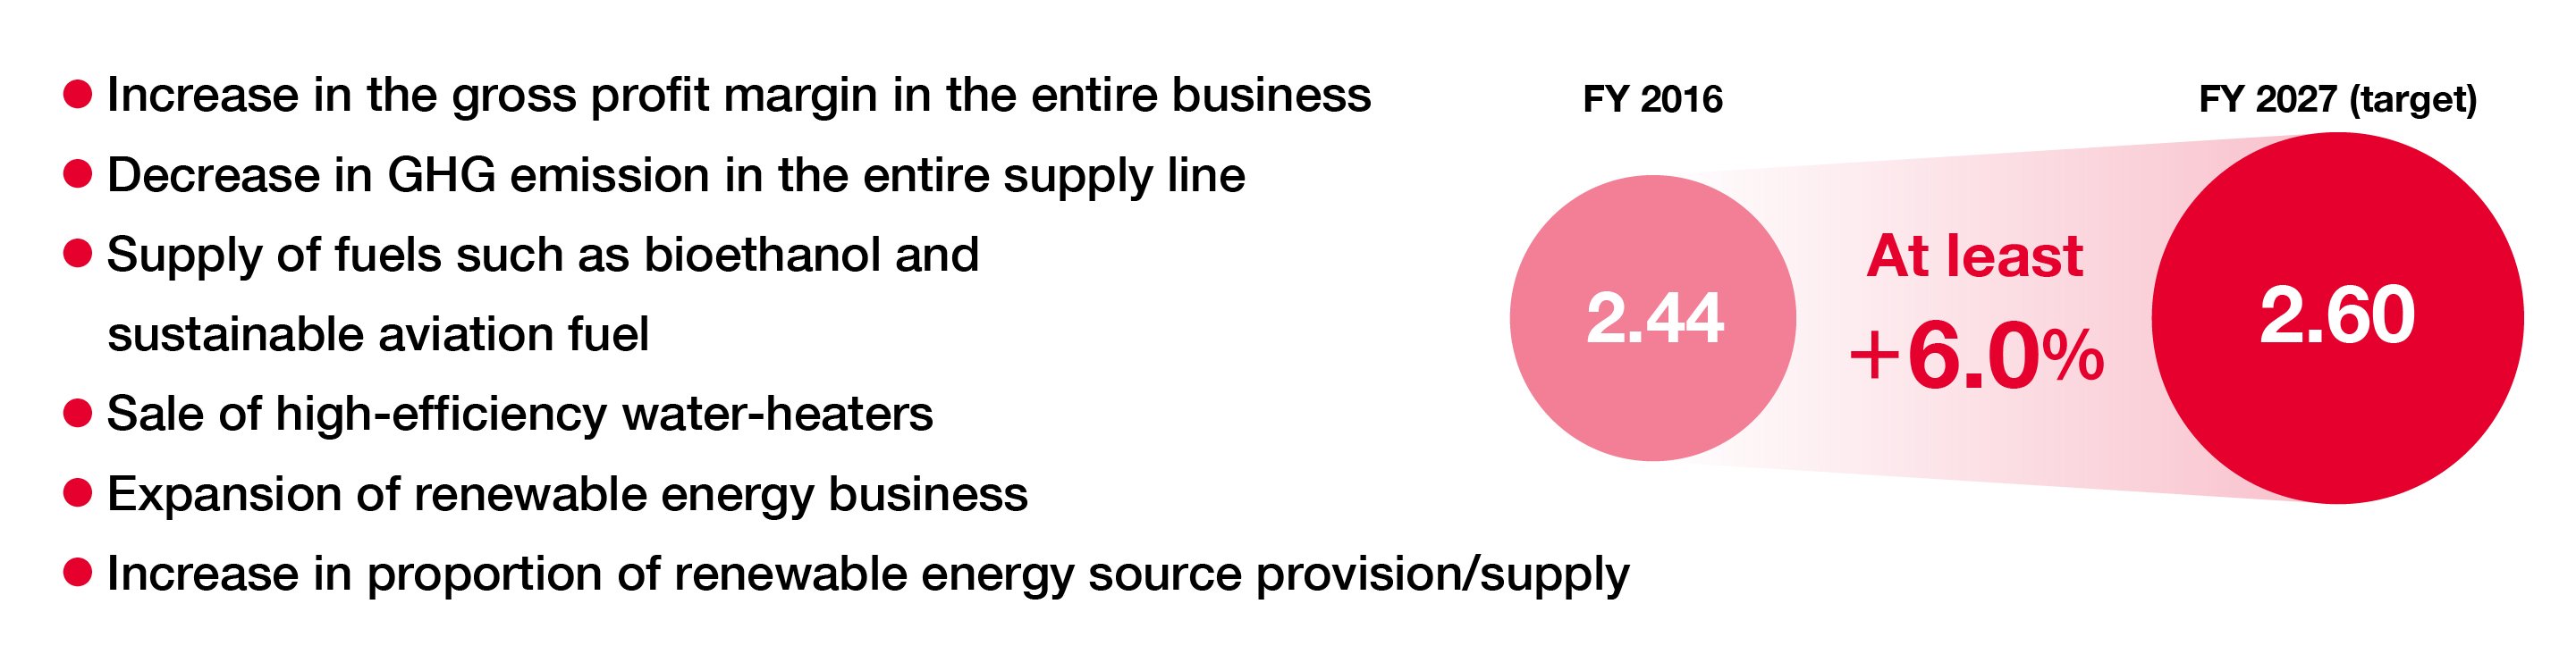
As an index of achieving not only financial expansion (sales, profits, etc.), but also decarbonization of the entire supply chain on the basis of cooperation with stakeholders, carbon productivity (i.e. measurement of productivity per ton of GHG emissions) will be adopted.
Carbon productivity = gross profit / GHG emission. The aim is to convert to a business structure appropriate to a decarbonized society, i.e. with lower GHG emission and higher profit generated.
| Subject Fiscal Year | Target |
|---|---|
| FY 2027 | Scope 1 to 3 6.0% increase in the entire supply chain (compared to FY2016) |
Specific Initiatives
| Category | Definition | Details for the Group | GHG Emissions (t) | |||
|---|---|---|---|---|---|---|
| FY2016 (base year) |
FY2020 | FY2022 | ||||
| Scope1 | Direct emissions from in-house operations | Upstream and downstream transportation of LP gas | 2,943 | 2,565 | 2,349 | |
| Use of LP gas in in-house operations | 2,924 | 2,541 | 2,309 | |||
| Scope2 | Indirect emissions from heat and electricity | Electricity consumption in offices, etc. | 3,456 | 2,577 | 2,143 | |
| Subtotal (Scope 1 and Scope 2) | 9,323 | 7,682 | 9,323 | |||
| Scope3 | category1 | Purchased products and services | Stocking of LP gas and petroleum products, purchasing of consumables, etc. | 1,379,700 | 1,194,252 | 1,185,297 |
| category2 | Capital goods | Manufacture and construction of fixed assets owned | 8,443 | 4,755 | 6,614 | |
| Category3 | Fuel, etc. not included in Scopes 1 and 2 | Use of electricity in upstream and downstream processes | 173,088 | 942,736 | 1,592,889 | |
| category4 | Transportation and delivery (upstream) | Upstream and downstream delivery of petroleum products | 112,352 | 98,177 | 92,889 | |
| category5 | Waste generated from business | Waste generated from business | 326 | 415 | 464 | |
| category6 | Business trips | Employee business trips | 725 | 377 | 640 | |
| category7 | Employee commuting | Employee commuting | 344 | 270 | 304 | |
| category11 | Use of sold products | Use of LP gas and petroleum products | 7,984,991 | 6,968,882 | 6,889,369 | |
| Total | 9,669,292 | 9,217,547 | 9,775,265 | |||
*Sinanen Holdings Co., Ltd., Sinanen Co., Ltd., and Melife companies Scope of Report (GHG emissions are calculated only for petroleum, gas, and electricity businesses)

